AI Workflow Diagrams Made Easy: Visualizing Automation Processes
AI automation is transforming how businesses handle repetitive tasks, analyze data, and manage operations. But complex automation systems can quickly become difficult to understand without a clear visual structure. That is where AI workflow diagrams become extremely useful.
Visual workflow diagrams help people understand complex AI automation processes more easily. They make it simpler for teams to design, analyze, and improve automated systems. An AI workflow diagram shows the sequence of tasks, triggers, and decision points that drive an automation process. It visually explains how each step connects to the next.
These diagrams help teams understand how data flows, where AI models make decisions, and how different tools interact within an automation pipeline.
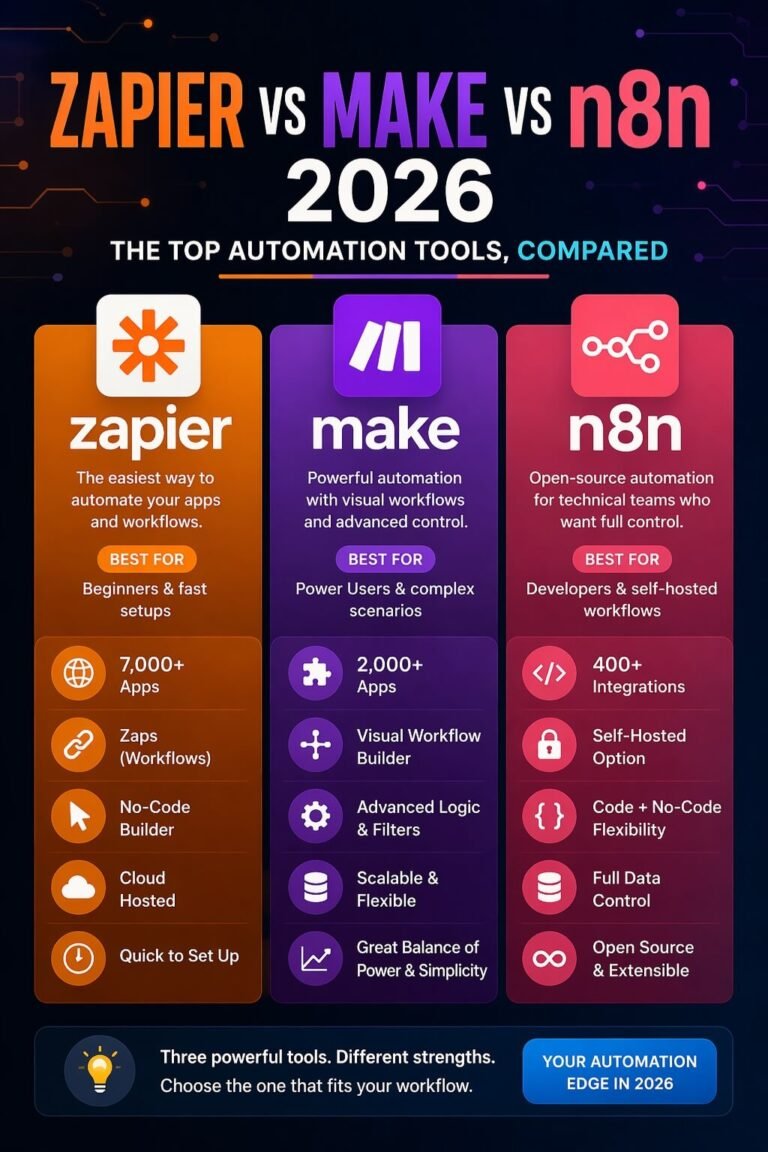
Clear workflow visualization improves collaboration between developers, marketers, and operations teams. It also reduces errors and makes automation easier to scale. Many modern automation platforms, such as n8n, Zapier, and Make, rely heavily on visual workflow diagrams to design automation processes.
This guide explains AI workflow diagrams, their components, how to build them, and the best tools to visualize automation processes effectively.
Table of Contents:
What Is an AI Workflow Diagram?
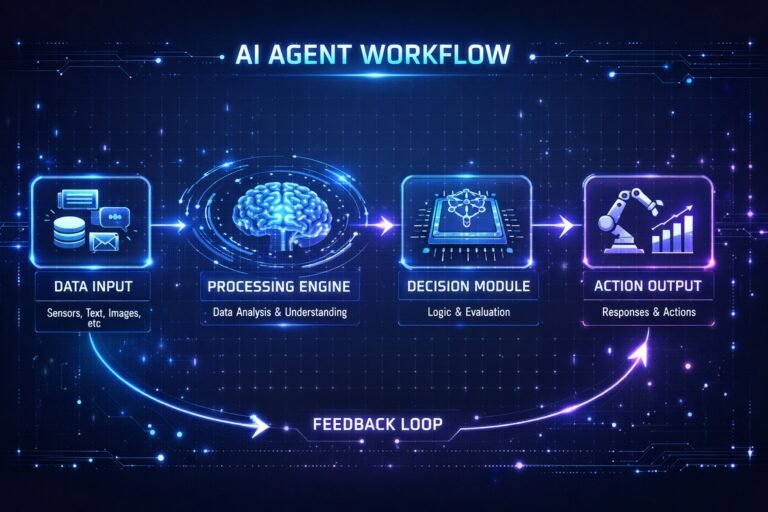
An AI workflow diagram is a visual representation of a process that includes automated tasks, data flow, and artificial intelligence decision points. It shows how different systems, triggers, and actions interact in a structured automation pipeline.
Traditional workflow diagrams usually represent simple business processes. AI workflow diagrams go further by including elements such as:
- Machine learning predictions
- AI decision nodes
- automated data processing
- external API integrations
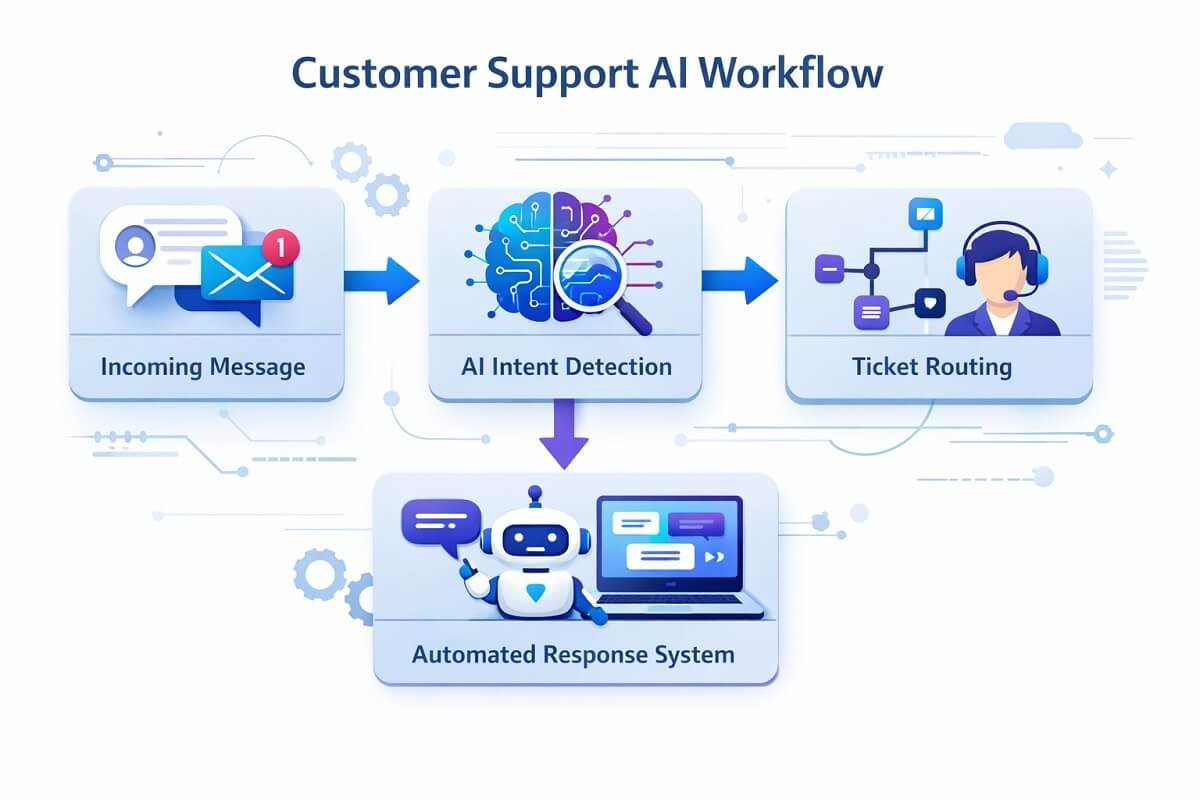
These diagrams help teams clearly understand how AI systems operate inside automation workflows. For example, an AI-powered customer support workflow might include:
- Incoming customer message
- AI intent detection
- automated ticket categorization
- routing to the correct department
A workflow diagram visually connects these steps so that the automation logic becomes easy to understand.
Why AI Workflow Diagrams Matter in Automation?
AI automation systems often include many interconnected tasks. Without a visual map, it becomes difficult to track how processes work. Workflow diagrams help solve this problem.
1. Better process clarity
Automation processes become easier to understand when every step is visualized.
2. Improved collaboration
Developers, marketers, and business teams can all understand automation workflows using diagrams.
3. Faster troubleshooting
Errors in automation pipelines are easier to locate when the entire workflow is mapped visually.
4. Easier workflow optimization
Teams can identify bottlenecks or redundant steps inside automation systems.
“These benefits explain why visual workflow tools are widely used in modern automation platforms.”
Key Components of an AI Workflow Diagram
Most AI workflow diagrams share several core elements.
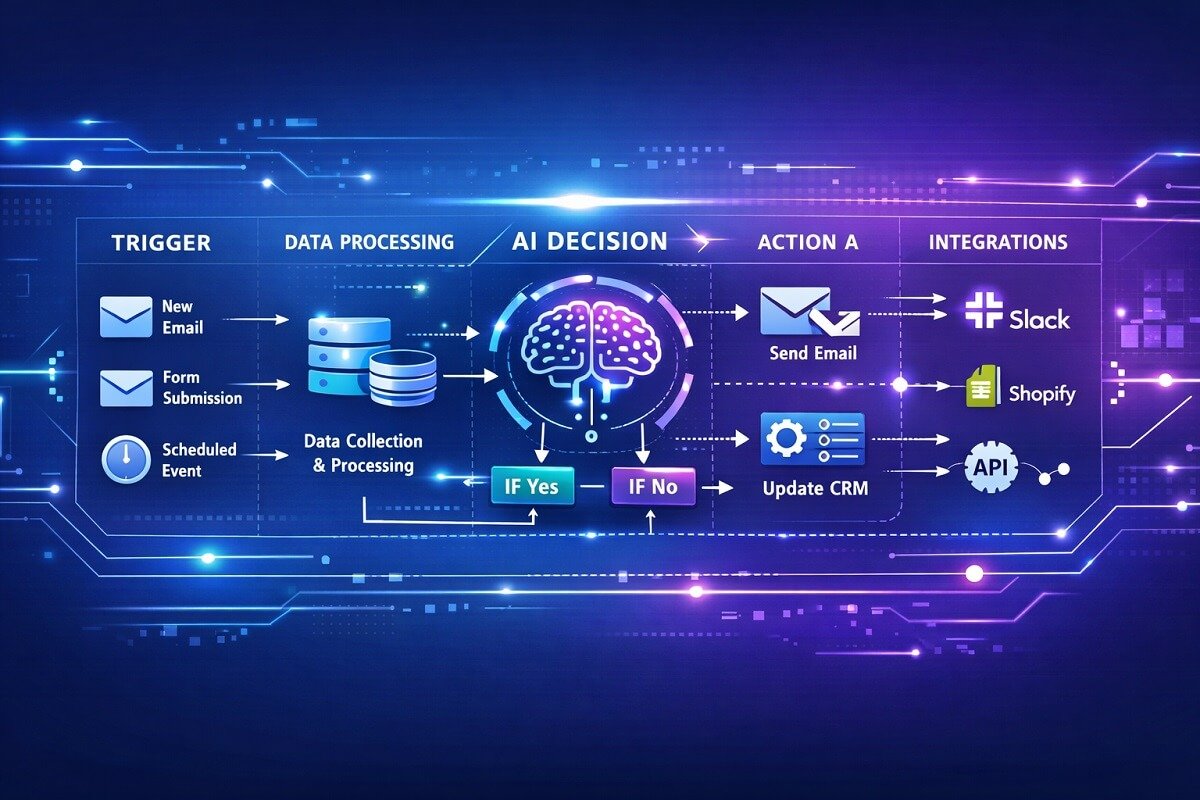
Trigger
A trigger starts the automation process.
Examples include:
- new email received
- form submission
- new database entry
- scheduled automation task
Actions
Actions represent the tasks executed during automation.
Examples:
- send an email
- update a CRM record
- post content to social media
- store data in a database
AI Decision Nodes
These nodes represent steps where AI analyzes data and makes decisions.
Examples include:
- text classification
- sentiment analysis
- recommendation systems

Data Flow
Data moves between different steps in the workflow. This could involve:
- API responses
- database queries
- AI model outputs
Integrations
Modern automation workflows often connect multiple software tools together. Common integrations include:
- CRM systems
- marketing platforms
- analytics tools
Types of AI Workflow Diagrams
Different diagram formats are used to visualize AI automation processes.
Process Flow Diagrams
These diagrams represent the sequence of steps in an automation pipeline. They are ideal for mapping:
- marketing workflows
- customer onboarding automation
- task automation systems
Data Flow Diagrams
These diagrams focus on how data moves between systems. They are commonly used in:
- machine learning pipelines
- analytics workflows
- data processing automation
Automation Workflow Maps
These diagrams highlight triggers, actions, and integrations between applications. Automation platforms often use this format.
Machine Learning Pipeline Diagrams
These diagrams show how data moves through:
- training datasets
- feature processing
- prediction models
- deployment systems
How AI Workflow Automation Works
AI workflow automation combines traditional automation with artificial intelligence capabilities. Many organizations build advanced systems using AI agent workflow automation to manage complex processes across multiple platforms.
The process typically follows this structure:
- A trigger activates the workflow.
- Data is collected from a source.
- AI models analyze the data.
- The system decides the next action.
- Automated tasks execute based on the decision.
“Automation tools like n8n and Zapier allow users to design these workflows visually, connecting triggers and actions through diagram-based interfaces. This approach makes complex automation accessible even to users without deep programming knowledge.”
How to Create an AI Workflow Diagram (Step-by-Step)
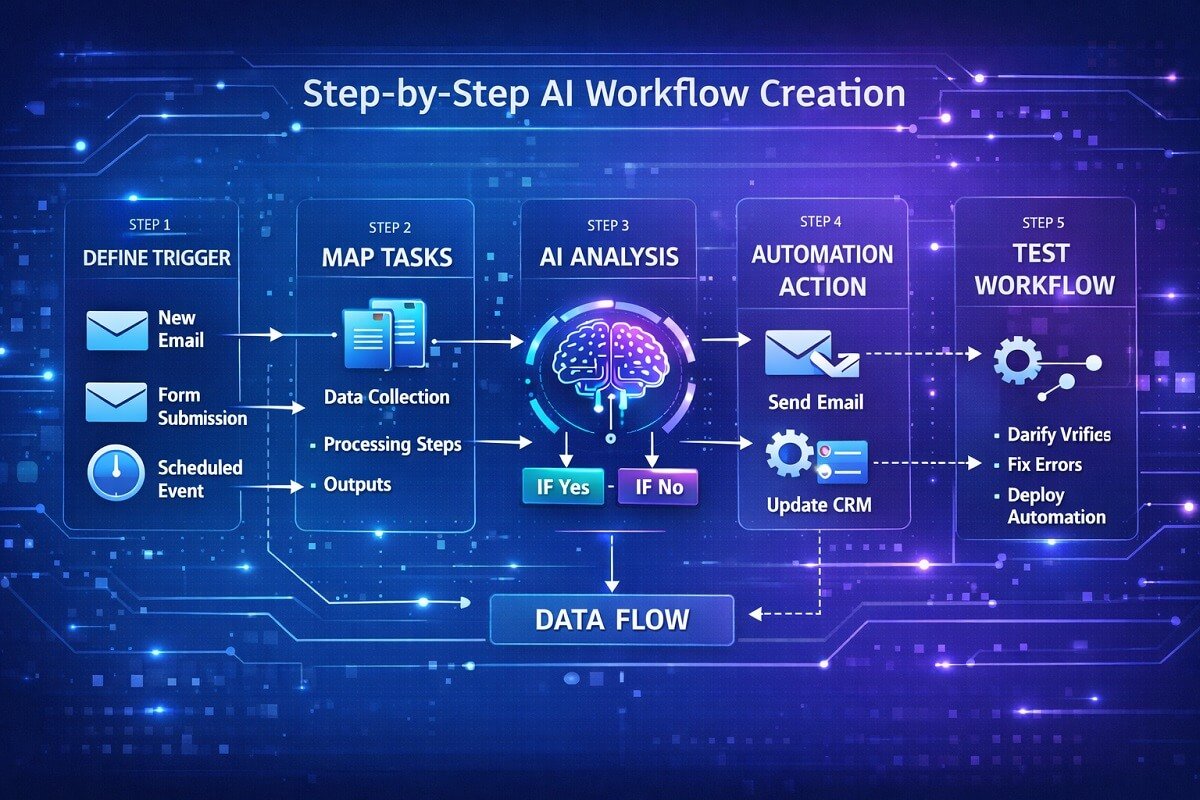
Understanding automation systems and AI workflows helps teams design diagrams that reflect real operational processes. However, creating an effective AI workflow diagram requires careful planning.
Step 1: Define the Process
Start by identifying the process you want to automate. Examples include:
- email marketing automation
- customer support routing
- content publishing pipelines
Clearly define the goal of the automation.
Step 2: Identify Triggers
Determine which event will start the workflow. Common triggers include:
- form submissions
- scheduled automation
- new customer signups
Step 3: Map the Workflow Tasks
List all the tasks involved in the automation process. These may include:
- data collection
- AI analysis
- automated responses
Step 4: Add AI Decision Points
Identify steps where AI analyzes information.
Examples include:
- natural language processing
- predictive scoring
- recommendation engines
Step 5: Connect Integrations
Link the software tools used in the workflow. For example:
- CRM systems
- email platforms
- analytics tools
Step 6: Test the Workflow
Before deploying the automation, test the workflow to ensure every step works correctly.
Best Tools for Creating AI Workflow Diagrams
Several tools help visualize automation workflows effectively.
1. Lucidchart
Lucidchart is a popular diagramming platform used to create process maps, automation workflows, and system diagrams.
Key features:
- drag-and-drop diagram builder
- collaboration tools
- automation templates
2. Miro
Miro is widely used for brainstorming and visual workflow mapping. It is useful for teams designing complex automation pipelines together.
3. Microsoft Visio
Microsoft Visio provides professional diagramming capabilities for enterprise process modeling. Many organizations use it to create advanced workflow diagrams.
AI Workflow Diagram Example: Customer Support Automation
Customer support teams often automate ticket management using AI workflows. Example workflow:
- Customer sends a support message.
- AI analyzes the message content.
- The system categorizes the request.
- The ticket is routed to the appropriate department.
- Automated replies are sent when possible.
“Visualizing this process with a workflow diagram helps support teams improve response time and reduce manual workload.”
AI Workflow Diagram Example: AI Content Creation Automation
Many marketing teams use AI content automation workflows to streamline publishing pipelines. Our research showed that content marketing teams frequently use different approaches AI automation for publishing workflows.
Example process:
- Keyword research tools generate topic ideas.
- AI writing software creates a draft.
- Content editors review the article.
- The CMS schedules publication.
- Social media posts are automatically generated.
“Mapping this process using workflow diagrams helps teams coordinate tasks across multiple tools.”
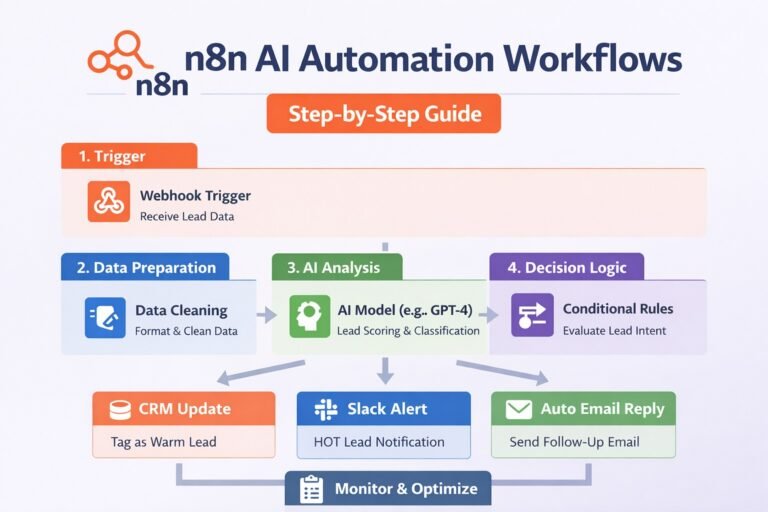
AI Workflow Diagram Example: Marketing Lead Scoring
AI can help marketing teams identify high-value leads automatically. Example workflow:
- A visitor submits a lead form.
- Data is stored in the CRM system.
- AI analyzes behavior patterns.
- Leads receive a predictive score.
- High-scoring leads are sent to sales teams.
“This automation improves marketing efficiency and sales conversion rates.”
Common Mistakes to Avoid in AI Workflow Diagrams
Poorly designed workflow diagrams can create confusion rather than clarity. Avoid these mistakes.
Overcomplicated diagrams
Too many steps make workflows difficult to understand.
Missing decision nodes
AI processes often include decision points that must be clearly represented.
Poor labeling
Every step in the workflow should have a clear and descriptive label.
Lack of documentation
Automation workflows should include notes explaining how each step works.
Best Practices for AI Workflow Visualization
Clear workflow diagrams follow several best practices.
Keep diagrams simple
Avoid unnecessary complexity.
Use consistent symbols
Standard workflow symbols improve readability.
Group related tasks
Organize workflow steps into logical sections.
Document AI decisions
Explain how AI models influence workflow outcomes.
“These practices make automation workflows easier to maintain and improve over time.”
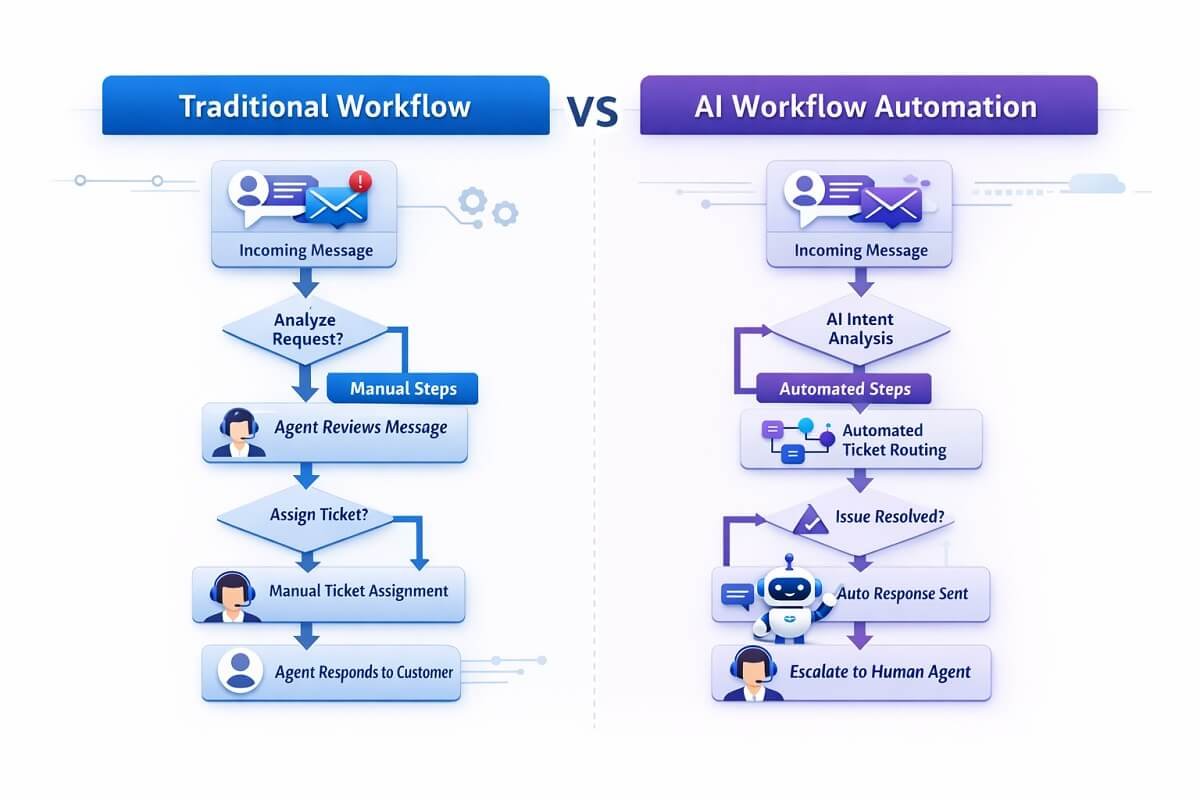
AI Workflow Diagrams vs Traditional Workflow Diagrams
Although they look similar, AI workflow diagrams differ from traditional diagrams in several ways.
| Feature | Traditional Workflow | AI Workflow |
| Decision logic | Manual rules | AI-driven decisions |
| Data analysis | Limited | Advanced machine learning |
| Automation level | Partial | Highly automated |
| Complexity | Moderate | Often complex |
AI workflows require more detailed visualization because of their advanced decision-making capabilities.
The Future of AI Workflow Automation
AI workflow automation continues to evolve rapidly. Emerging trends include:
- AI agents that run autonomous workflows
- predictive automation systems
- real-time decision-making pipelines
- self-improving automation models
“As automation tools continue to improve, visual workflow diagrams will remain an essential part of designing efficient AI systems.”
Conclusion
AI workflow diagrams provide a clear visual representation of how automated systems operate. They help teams understand complex automation pipelines, improve collaboration, and identify opportunities for optimization.
By mapping triggers, actions, AI decision points, and integrations, organizations can build efficient automation workflows that reduce manual effort and improve productivity.
Whether you are designing marketing automation, AI-powered customer support systems, or data processing pipelines, visual workflow diagrams make it easier to plan and manage automation processes effectively. As AI adoption continues to grow, mastering workflow visualization will become an increasingly valuable skill for developers, marketers, and business teams alike.
Frequently Asked Questions
What is the difference between an AI workflow diagram and an automation workflow?
An AI workflow diagram includes intelligent decision-making steps where algorithms analyze data and determine outcomes. A standard automation workflow follows fixed rules without learning or adapting. AI workflows are more dynamic and can improve over time based on data patterns.
How do AI workflow diagrams improve business efficiency?
AI workflow diagrams help teams identify inefficiencies such as redundant tasks, delays, or unnecessary integrations. By visualizing the full process, businesses can streamline operations, reduce manual intervention, and ensure faster execution of automated tasks.
Can beginners create AI workflow diagrams without coding skills?
Yes, many modern tools offer visual drag-and-drop interfaces that allow beginners to build workflows without writing code. Platforms like Zapier, n8n, and Make help it easy to design and manage workflows visually.
What industries benefit most from AI workflow diagrams?
AI workflow diagrams are widely used across industries such as:
- Marketing automation
- Customer support operations
- E-commerce and sales funnels
- Healthcare data processing
- Finance and fraud detection
“Any industry that relies on repetitive processes and data-driven decisions can benefit from workflow visualization.”
How detailed should an AI workflow diagram be?
An effective workflow diagram should balance clarity and detail. It should include all critical steps such as triggers, actions, and AI decision points, but avoid unnecessary complexity. Overloading a diagram with too many elements can make it harder to understand and maintain.
Are AI workflow diagrams useful for team collaboration?
Yes, they play a major role in cross-team collaboration. Visual workflows allow developers, marketers, and operations teams to align on processes without needing deep technical knowledge. This shared understanding reduces miscommunication and speeds up project execution.
What are the best formats to export or share workflow diagrams?
Most diagram tools allow exporting workflows in formats such as:
- PNG or JPEG for presentations
- PDF for documentation
- Interactive links for team collaboration
- Embedded diagrams for websites
“Choosing the right format depends on whether the diagram is used for internal collaboration or external documentation.”
How often should AI workflows be updated or reviewed?
AI workflows should be reviewed regularly, especially when:
- Business processes change
- New tools or integrations are added
- AI models are updated or retrained
- Performance issues are detected
“Regular updates ensure the workflow remains efficient and aligned with current goals.”
Do AI workflow diagrams help with scaling automation systems?
Yes, they are essential for scaling. A well-structured diagram acts as a blueprint that allows teams to expand workflows, add new integrations, and handle higher data volumes without breaking the system.
What are common tools used alongside AI workflow diagrams?
Besides diagramming tools, teams often use:
- CRM platforms for customer data
- Analytics tools for performance tracking
- AI APIs for decision-making
- Cloud storage systems for data handling
“Workflow diagrams help visualize how all these tools interact within a single automation ecosystem.”